Understand time-weighted and money-weighted returns, cash flows, fees and benchmarks in an investment performance report, with a worked AED example.
An investment account can grow even when the investments have lost money. A contribution increases the balance; a withdrawal reduces it. Neither movement, on its own, tells you how the portfolio performed.
For UAE expats receiving statements from several providers, the challenge is often more basic than deciding whether a return was good: are the figures answering the same question?
A useful investment performance report identifies the accounts covered, measurement period, reporting currency, calculation method and treatment of costs. Time-weighted returns help separate investment performance from external cash flows. Money-weighted returns reflect the timing and size of those flows. Both can be informative, but they are not interchangeable.
This guide explains how to read those measures, using a fictional example rather than a product recommendation.
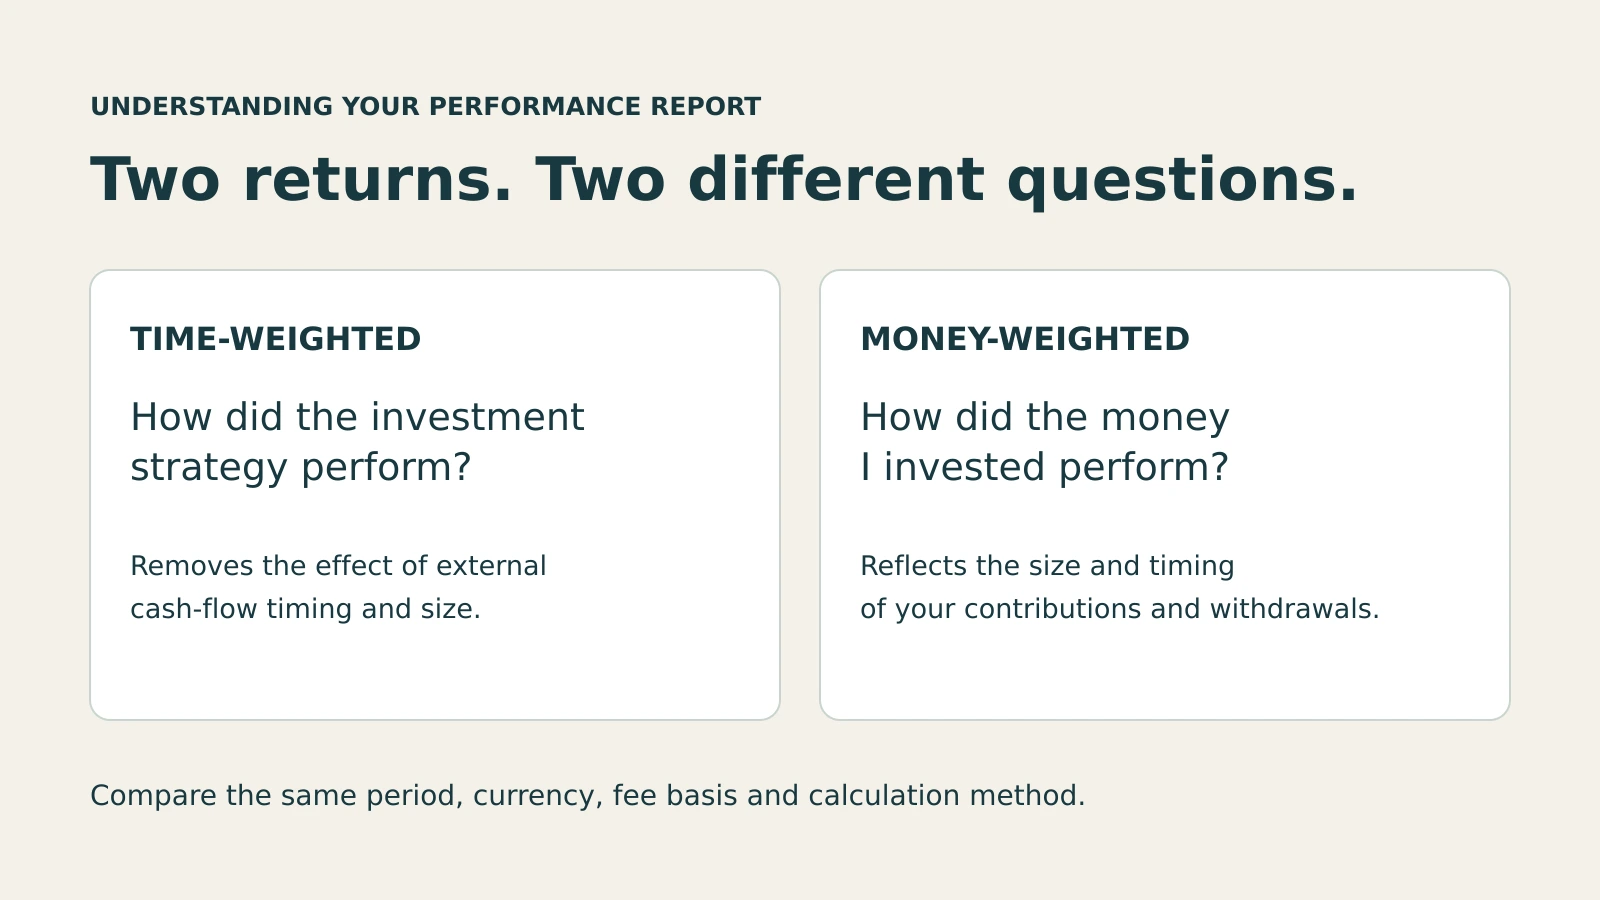
Original conceptual illustration. No client data or actual performance is shown.
Start with the balance, but do not stop there
Begin by asking what the report covers. Is it one account, a group of investment accounts or the family's entire wealth? Does it include cash held with the provider? Are transferred investments included from their transfer date or from an earlier purchase date?
Then reconcile the opening and closing values with contributions, withdrawals and the remaining investment movement. The SEC's account-statement guide distinguishes deposits and withdrawals from changes in investment value and shows why the dates and amounts of transactions matter.
For example, an account that begins at AED 500,000 and ends at AED 620,000 after an AED 150,000 contribution has not earned 24%. In this simplified reconciliation, AED 30,000 has been lost through investment movements and any included costs. A valid percentage return still needs an appropriate method and the relevant timing information.
Keep the provider's original statements. A consolidated performance report should help explain them, not replace the evidence behind them.
What is a time-weighted return?
A time-weighted return, or TWR, is designed to remove the effect of external contributions and withdrawals. In a true TWR calculation, the portfolio is valued at each external cash flow, returns are calculated for the intervening periods, and those returns are compounded together.
This makes TWR useful when examining the investment strategy without attributing a client's decision to add or remove money to the manager. The GIPS Standards Handbook for Firms explains the methodology.
The word “time-weighted” does not mean taking a simple average of annual returns. A gain of 10% followed by a loss of 10% does not cancel out: the second percentage applies to a different value.
Ask which calculation the provider uses and whether valuations were available when money moved. A precise-looking figure is not a substitute for a clear methodology.
What is a money-weighted return?
A money-weighted return, or MWR, incorporates the amount and timing of external cash flows. A commonly used calculation is the internal rate of return, or IRR: the rate that equates the present values of the money invested and the money received, including the ending value.
Its practical purpose is to describe the result associated with the money invested on those dates. More capital exposed to a weak period can produce a worse money-weighted result than the portfolio's time-weighted result.
CFA Institute's explanation of performance reporting treats the two methods as answers to different questions, not competing versions of a single “correct” return.
A lower MWR does not, by itself, establish poor investment management or a bad personal decision. A contribution may have followed a bonus, business sale or another practical constraint. The numbers describe what happened; the circumstances explain why.
Worked example: one account, two legitimate return measures
Consider a fictional portfolio measured over two equal one-year periods. All figures are invented. There are no fees, taxes, currency movements or withdrawals, and all investment income is included in the stated returns.
- The investor contributes AED 100,000 at the beginning of year one.
- The portfolio gains 10%, reaching AED 110,000 at the end of year one.
- The investor immediately contributes another AED 100,000, bringing the invested balance to AED 210,000.
- The portfolio loses 10% during year two, ending at AED 189,000.
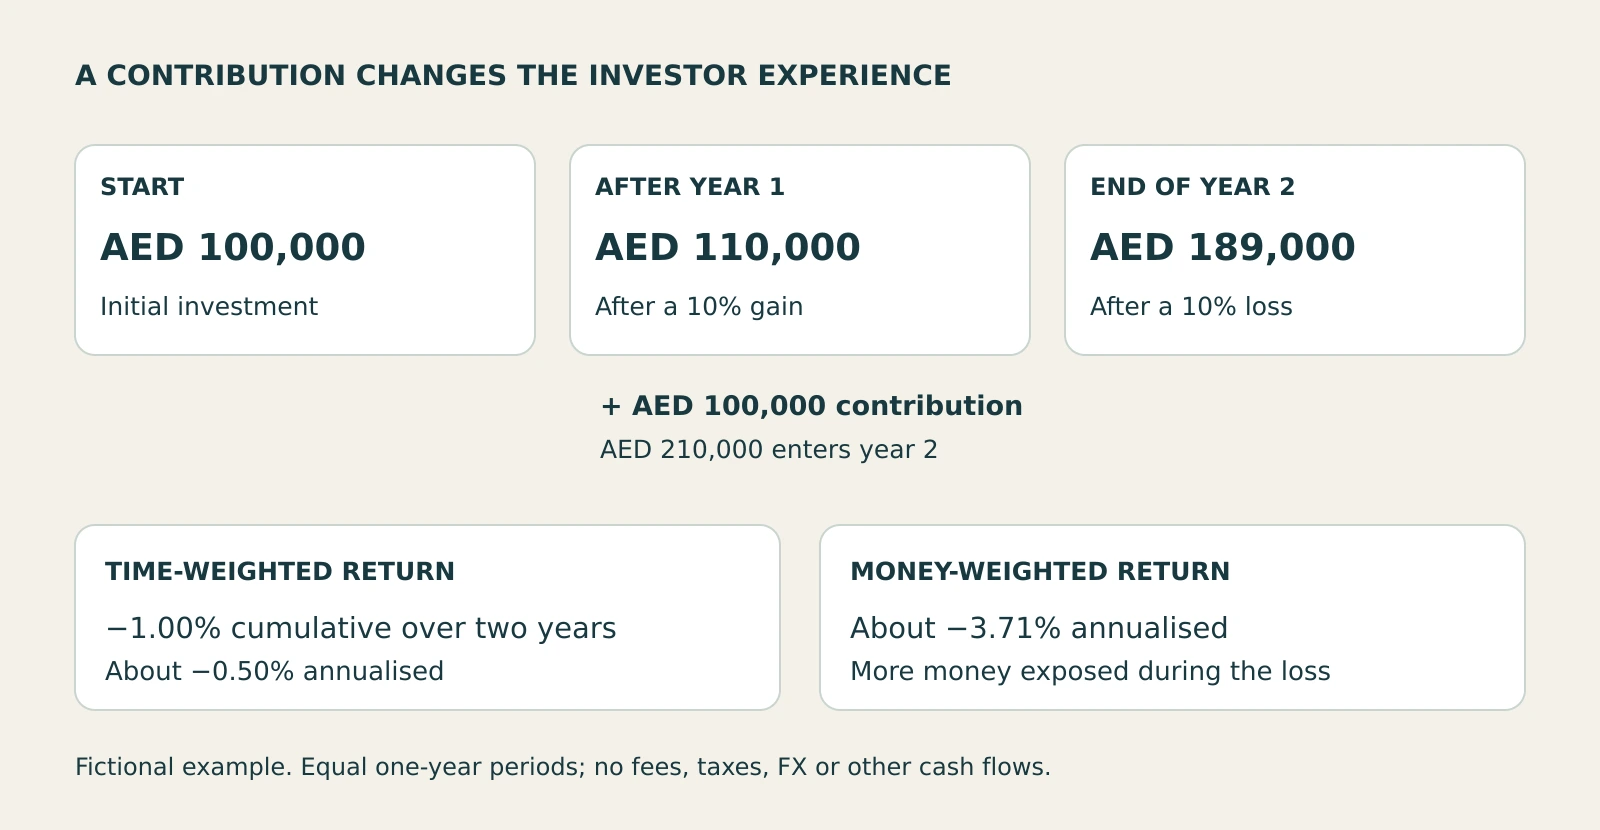
Fictional illustration with equal one-year periods. Figures are explained below and are not forecasts.
The balance tells one part of the story
The ending balance is AED 89,000 higher than the original AED 100,000. But total contributions were AED 200,000. The investor finishes with AED 11,000 less than the money contributed.
Calling the AED 89,000 increase an “89% investment gain” would confuse saving with investment performance.
TWR describes the investment path
Compound the two annual returns:
1.10 × 0.90 − 1 = −1.00% over two years.
The equivalent annualised TWR is approximately −0.50% a year. It describes the compounded investment path after removing the effect of the additional contribution.
MWR reflects the cash-flow experience
The annualised MWR is approximately −3.71%. It is the rate at which AED 100,000 invested for two years, plus AED 100,000 invested for one year, would produce the AED 189,000 ending value.
More money was invested during the losing year than during the gaining year. That is why the MWR is lower.
For a like-for-like reading of the annualised measures, compare −0.50% TWR with −3.71% MWR. Do not silently compare a two-year cumulative figure with an annualised figure.
Neither number is a forecast. Neither tells this fictional investor what to buy, sell or change.
“Net of fees” needs a definition
Do not assume “gross” means before every cost or “net” means after everything the household pays. In GIPS terminology, gross-of-fees returns deduct transaction costs; net-of-fees returns also deduct investment-management fees. Other deductions require attention to the disclosures.
For your own report, request a short written explanation of which charges are already reflected. Questions worth resolving include:
- Are advice, platform and custody charges included?
- How are underlying fund expenses treated?
- Are charges paid from another account reflected?
- Are fees actual amounts or modelled assumptions?
- Is the result before or after relevant taxes?
The SEC's performance-claims bulletin recommends checking which expenses a performance calculation excludes and how those exclusions affect the result.
The task here is interpretation, not subtracting the same expense twice. Ask the provider to reconcile its reported result before making your own adjustment.
Align the period, currency and benchmark
Before comparing two reports, put their start and end dates side by side. A calendar-year result and a since-inception result describe different windows. An annualised figure describes an equivalent compounded yearly rate, not a return earned identically in every year.
Next, identify the reporting currency. An overseas investment can show a different percentage return when translated into another currency because exchange rates change. The SEC's international-investing guidance explains this effect. A UAE-based family comparing an AED report with a GBP report should resolve the currency basis before interpreting the difference.
Finally, inspect the benchmark. Record its name, coverage, currency and whether it includes income. Comparing an income-inclusive portfolio return with a price-only index can distort the picture. The GIPS benchmark guidance addresses matching periods, currency and total-return measures.
A familiar index is not automatically an appropriate comparison for a portfolio with different investments and objectives. Ask why it was selected. Also check whether the benchmark reflects costs comparable to those in the portfolio result.
Turn an unexplained difference into a focused question
Suppose one dashboard shows 6% and another shows 4%. Do not immediately conclude that one provider made an error. Make a short comparison record:
- Accounts and assets included.
- Start date, end date and valuation dates.
- TWR, MWR or another stated method.
- Cumulative or annualised presentation.
- Currency and conversion methodology.
- Included costs, taxes and investment income.
- Cash flows and any missing or estimated data.
Ask the provider to identify which differences explain the gap and supply a revised calculation if an error is found. Keep the original and revised versions together, with the explanation.
This is a reporting exercise, not an instruction to trade. For a broader assessment of holdings, goals and access to money, use the separate portfolio review checklist for UAE expats.
Frequently asked questions
Which is better: TWR or MWR?
Neither is universally better. They answer different questions. Request the measure suited to the question being asked, with its assumptions explained; using both can help explain a difference between the investment path and the investor's experience.
Does a GIPS reference mean my personal report is GIPS compliant?
No. The GIPS Standards Handbook for Firms explains that GIPS composite and pooled-fund reports are designed for prospective clients and investors. A personal account statement is not, by itself, evidence of compliance. Citing a calculation method does not establish a firm's compliance. This article makes no compliance claim for any provider.
Does a strong historical return establish suitability?
No. A return figure does not settle whether the investment's risks, terms or objectives fit your circumstances. Historical performance also does not establish what will happen next.
Make the next conversation about the evidence
Bring the original statements and the performance report, then identify the particular figure you cannot explain. That gives the discussion a concrete starting point: a calculation to understand, rather than a headline to defend.
Read about Wealth Manager Dubai's portfolio-management service, or contact Wealth Manager Dubai to discuss your reporting questions. Ask how to share documents securely before sending statements or personal financial information.
Educational information only. This article is not personal investment, tax or legal advice, a recommendation to transact, or a performance claim for any firm. Investments can fall in value. Calculations are simplified illustrations; actual reporting depends on the data, methodology and applicable arrangements.
This article is illustrative content provided for information only and does not constitute financial, tax or legal advice. Tax rules and thresholds change and depend on individual circumstances and jurisdiction. Always seek personalised professional advice.